OVERVIEW

Pairgap simplifies the home co-ownership process for multiple buyers, making homeownership and real estate investments accessible to millennials and Gen Z by splitting costs on properties.

The SaaS platform expedites the co-buying process by matching viable buyers, identifying properties, securing loans, drafting co-buying contracts, and guiding buyers through every step until closing.

PROBLEM

During the alpha phase, our testing involved onboarding groups of potential co-buyers ranging from two to eight groups of people prior to advancing through the platform. We facilitated calls between co-buyers and real estate professionals to manually divide investments, estimate mortgages, and calculate Debt-to-Income ratios, along with splitting all associated costs for each individual.

However, fluctuations in the number of co-buyers led to frequent adjustments in calculations, necessitating multiple calls for discussion. This process consumed considerable time and the average of 150 minutes and disrupted the streamlined paid subscription platform workflow, resulting in delays in home searches and offers within the 90 day pre-approval window.

In contrast to singular buyers, online estimations were readily available for mortgage calculations and qualifying Debt-to-Income (DTI) assessments. This enabled individual buyers to expedite the process and assess affordability independently, streamlining initial qualifications.

SOLUTION

Rather than relying solely on continuous phone calls and meetings for calculations, our team embarked on a pioneering initiative: the creation of a revolutionary co-buying calculator. This innovative tool, a first in the industry, would empower multiple co-buyers with forecasts of potential payment splitting estimates, providing a comprehensive visualization of homeownership possibilities for individuals and groups. It would automatically adjust on the platform, regardless of the number of buyers or the stage you’re in the home buying process.

The final product feature will be an integrated Mortgage Calculator and Debt-to-Income (DTI) calculator with enhanced functionality for customized affordability assessments for groups of up to four buyers.

APPROACH

The initial approach involved a comprehensive examination of existing mortgage calculators and debt-to-income (DTI) calculators for individuals, documenting potential formulas for development, and creating a design strategy for integration into a cohesive tool for co-buyers.

MORTGAGE CALCULATIONS

A mortgage calculator assesses monthly mortgage payments by considering factors such as loan amount, interest rate, and term. Additionally, it computes principal and interest payments, total payments, and may incorporate taxes and insurance.

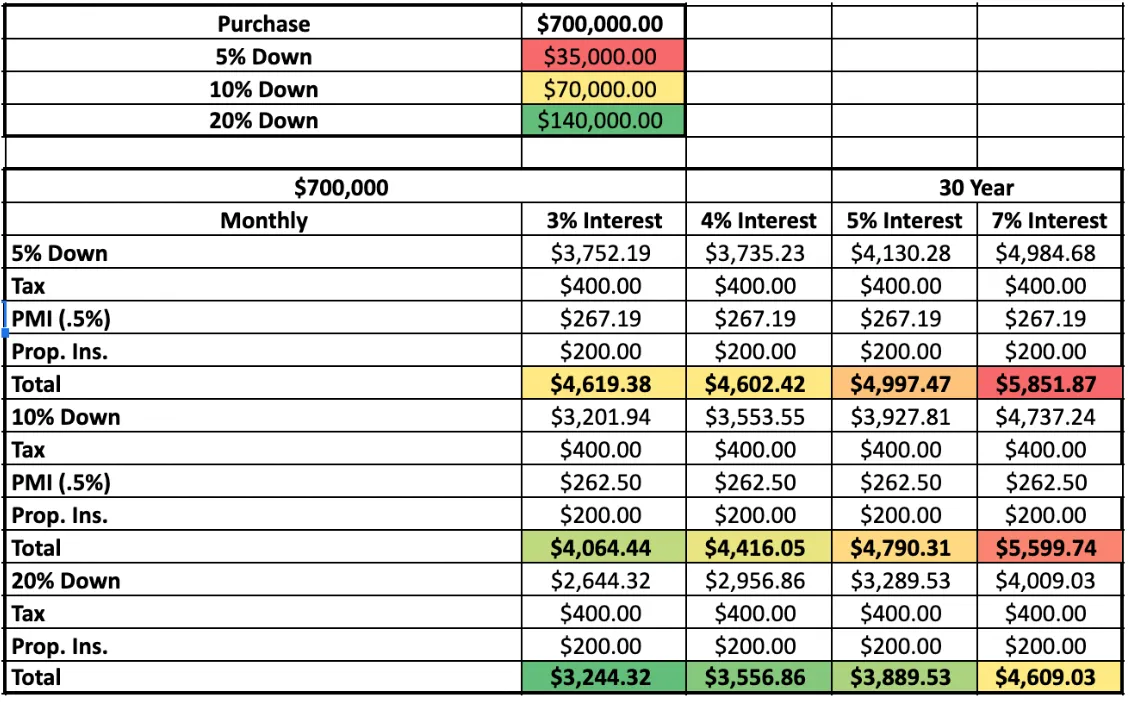
I started with a thorough exploration of existing mortgage calculators. Notable examples such as Bankrate and NerdWallet stood out for their innovative design and functionality, serving as sources of inspiration for monthly payment calculations. During this process, I encountered three formulas for calculating monthly payments:

Formula 1
Monthly Payment = P x (r / n) x (1 + r / n)^n(t)] / (1 + r / n)^n(t) — 1

Formula 2
Monthly Payment = P[ i(1 + i)^n ] / [ (1 + i)^n — 1]

M = monthly mortgage payment
P = principal amount
i = monthly interest rate (derived by dividing the annual rate by 12)
n = total number of payments over the loan term

Formula 3
L[c(1 + c)^n]/[(1 + c)^n — 1]

The “L” represents the loan amount, “c” denotes the per-payment interest, and “n” signifies the payment number.

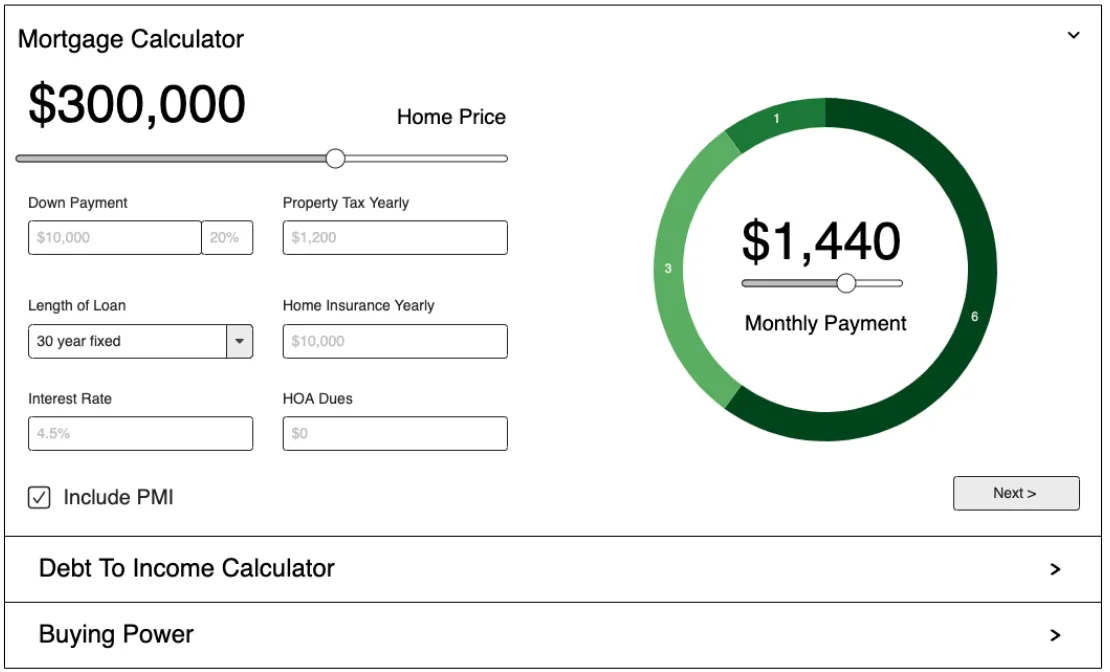
After documenting all the features and formulas required for the Monthly Payment and noting all three to consider how they would function in conjunction with the Debt-to-Income, I proceeded to experiment during the initial design phase. I opted for a user-friendly design style inspired by Zillow.

Home Price
The cost or value of a residential property being bought or sold. It represents the amount of money that a buyer is willing to pay for a home, or the price at which a seller is willing to sell their property.

Down Payment
The borrower’s amount of money towards the purchase.

Length of Loan
The term of your loan is how long you have to repay the loan.

Home Insurance Yearly
This is the annual premium paid to an insurance company to protect against financial losses due to damages to the home and its contents. Home insurance typically covers events like fire, theft, and natural disasters.

Property Tax Yearly
This is the annual tax levied by the local government on the assessed value of a property. Property taxes are used to fund local services such as schools, roads, and public safety.

Interest Rate
The percentage of the outstanding balance of a loan that you are charged for borrowing money is usually expressed as an annual percentage rate. Interest is only one of
many costs associated with getting a mortgage. It is calculated using 30-year conforming rates.

HOA Dues
HOA stands for Homeowners Association. HOA dues are fees paid by homeowners to the association for the maintenance and management of common areas and amenities in a community or neighborhood governed by an HOA.

Private Mortgage Insurance  (PMI)
Borrowers making a down payment of less than 20 percent of the home’s purchase price will need to pay for mortgage insurance. Mortgage insurance also is typically required on FHA and USDA loans. Mortgage insurance lowers the risk to the lender of making a loan to you, so you can qualify for a loan that you might not otherwise be able to get. But, it increases the cost of your loan. If you are required to pay mortgage insurance, it will be included in the total monthly payment that you make to your lender, your closing costs, or both.

Monthly Payment
The total monthly home payment will include mortgage principal, interest, property taxes, and homeowner’s insurance. HOA will not be included in this calculator for this first version.

DEBT-TO-INCOME (DTI) CALCULATIONS

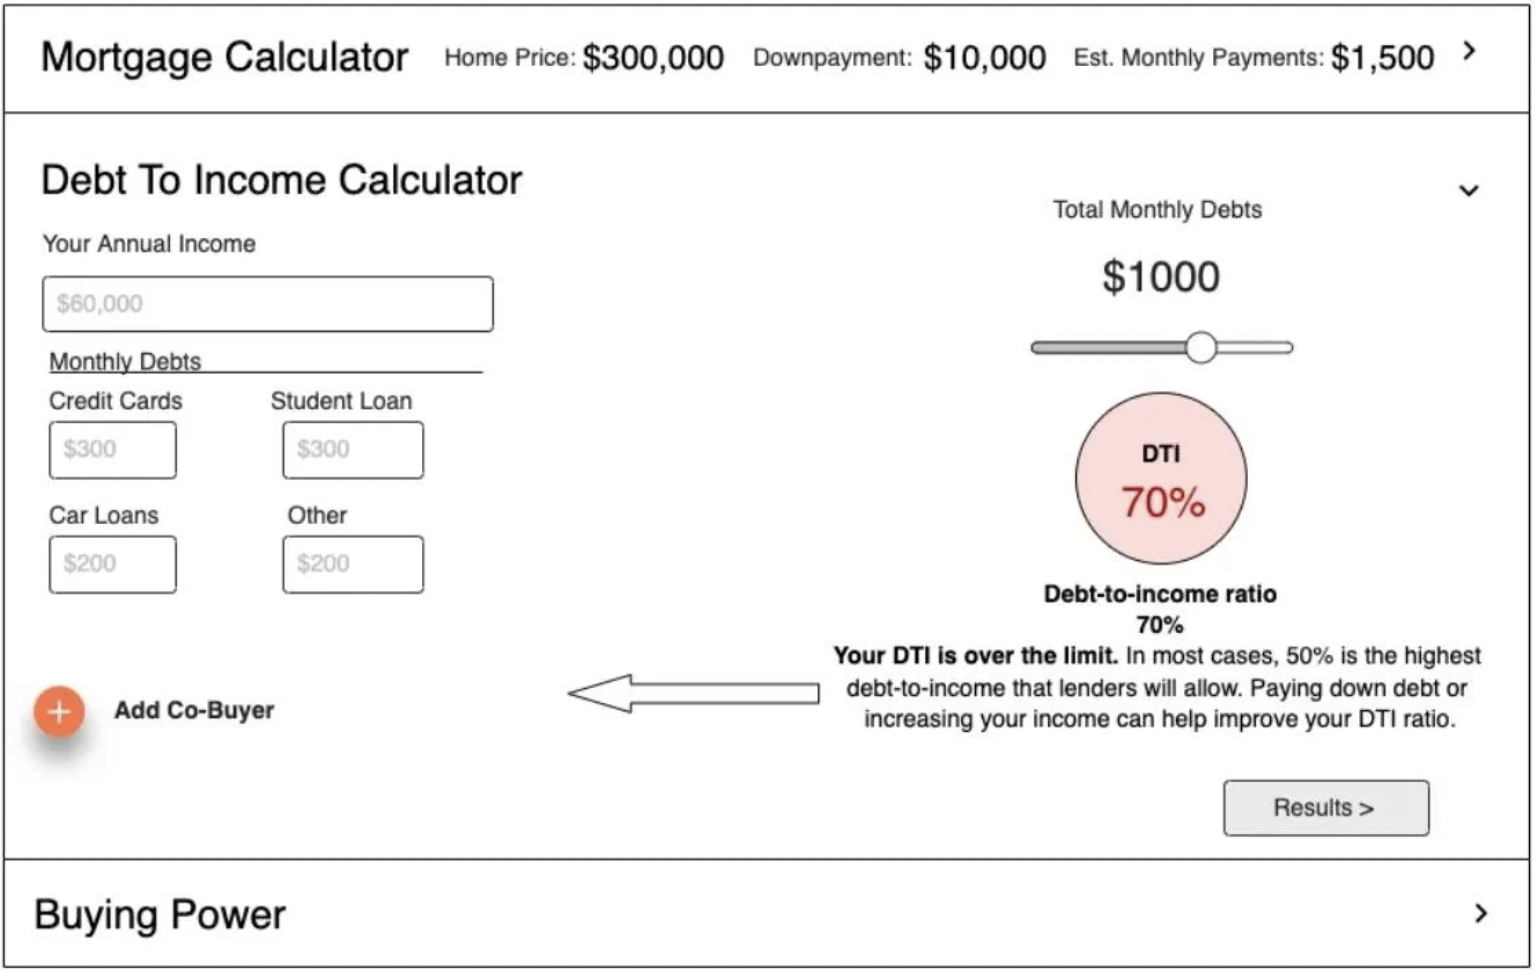
The Debt-to-Income DTI ratio serves as a critical financial metric, comparing an individual’s monthly debt payment to their gross monthly income. This ratio is instrumental for lenders, particularly mortgage lenders, in assessing an individual’s capacity to manage monthly payments and repay debts.

Upon examination, it was observed that the majority of platforms employ similar formulas for DTI calculations, which is as follows:

DTI = Gross Monthly Income / Total of Monthly Debt Payments

Sum up all monthly debt payments, including credit cards, loans, and other obligations. Divide the total monthly debt payment amount by the monthly gross income. Multiply the result by 100 to obtain the DTI percentage.

Although the DTI calculation is conceptually straightforward, I refined the design to enhance its visualization of Mortgage Payments with the DTI Calculation. This involved documenting all features and DTI Calculation for development.

FINAL CALCULATIONS

After trial and error with all three mortgage calculations, we finalized with Formula 2: Monthly Payment = P [ i(1 + i)^n ] / [ (1 + i)^n — 1] for the mortgage calculation to work in conjunction with the standard DTI calculation: Gross Monthly Income / Total of Monthly Debt Payments.

We documented and finalized an Excel spreadsheet to conduct experiments for individual buyers.

ZIP CODES ENHANCEMENTS

During our initial research, we discovered that leading calculators achieved more accurate monthly mortgage estimates by incorporating Zip Codes for tax calculations. To ensure precision and innovation, we compiled a comprehensive database containing all 41,704 US zip codes and their respective regions for integration into the final estimates.

AFFORDABILITY FEATURE

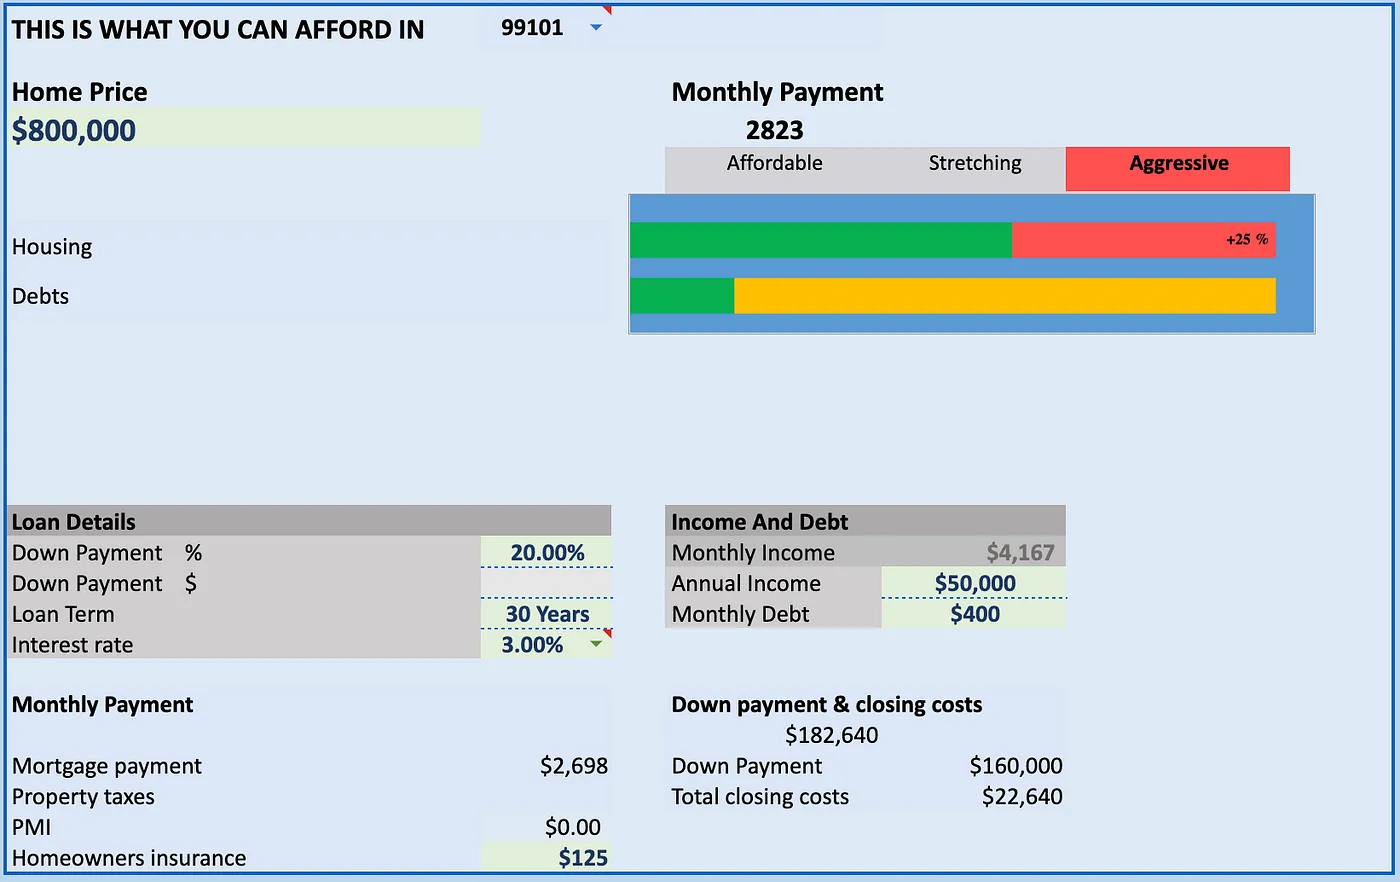
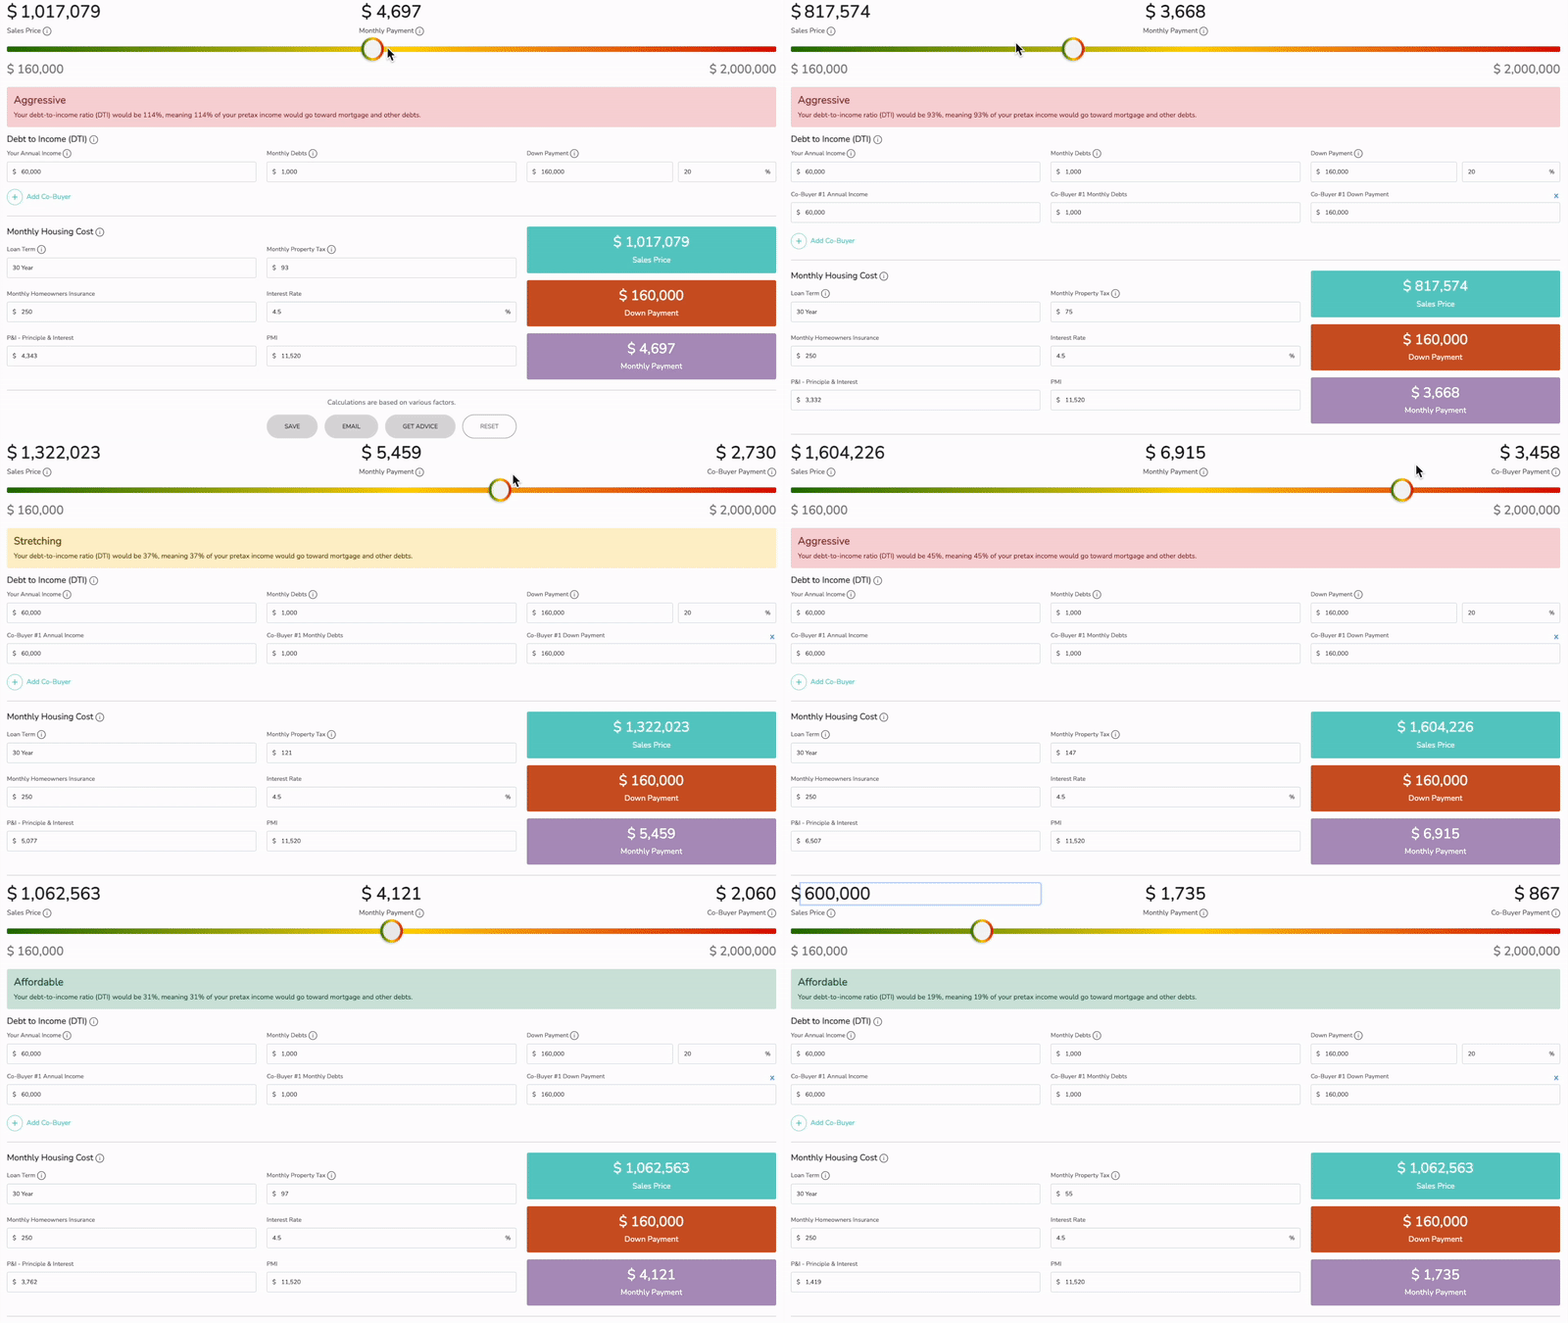
Utilizing these calculations, we integrated a feature to determine if the buyer’s Debt-to-Income (DTI) ratio aligns with the property’s affordability. We categorized the affordability levels as Affordable, Stretching, and Aggressive, taking into account the taxes associated with the property’s Zip Code.

Keeping your Debt-to-Income (DTI) ratio below 36% is a commonly advised guideline when buying a home. This threshold is considered a standard practice to ensure financial health and prudent decision-making in the home purchasing process.

We devised tailored recommendations and fine-tuned these functionalities in Excel for individual buyers to present a clear visualization of the affordability spectrum.

Affordability
The maximum amount can be borrowed and comfortably paid each month, as shown by the slider going up and down.

Affordable
36% and Below will be calculated on the slider for the debt-to-income ratio (DTI) would be 36%, meaning 36% of your pretax income would go toward mortgage and other debts.

Stretching
36% to 43% will be calculated as stretching on the slider. The maximum payment you can afford. How much you borrow is different from how much you can afford to repay without stretching your budget for other important items too thin.

Aggressive
43% or more. You may not qualify based on the information provided. You may need a higher income or increase the amount of your down payment.

MORTGAGE CALCULATOR & DTI (DEBT-TO-INCOME) INTEGRATION

After establishing the DTI for individuals and integrating an affordability spectrum with a random tax percentage, we integrated 41,704 US zip codes into Excel. This automated adjustment ensured more precise affordability calculations to complete the integration of the mortgage and DTI calculations.

The process begins with the buyer entering the home price and zip code. The prices are then automatically adjusted based on the zip code’s tax rates. Buyers can then input their deposit amount, loan term, and DTI. The calculations yield final amounts and categorize the purchase as either affordable, stretching, or aggressive.

CO-BUYER CALCULATIONS

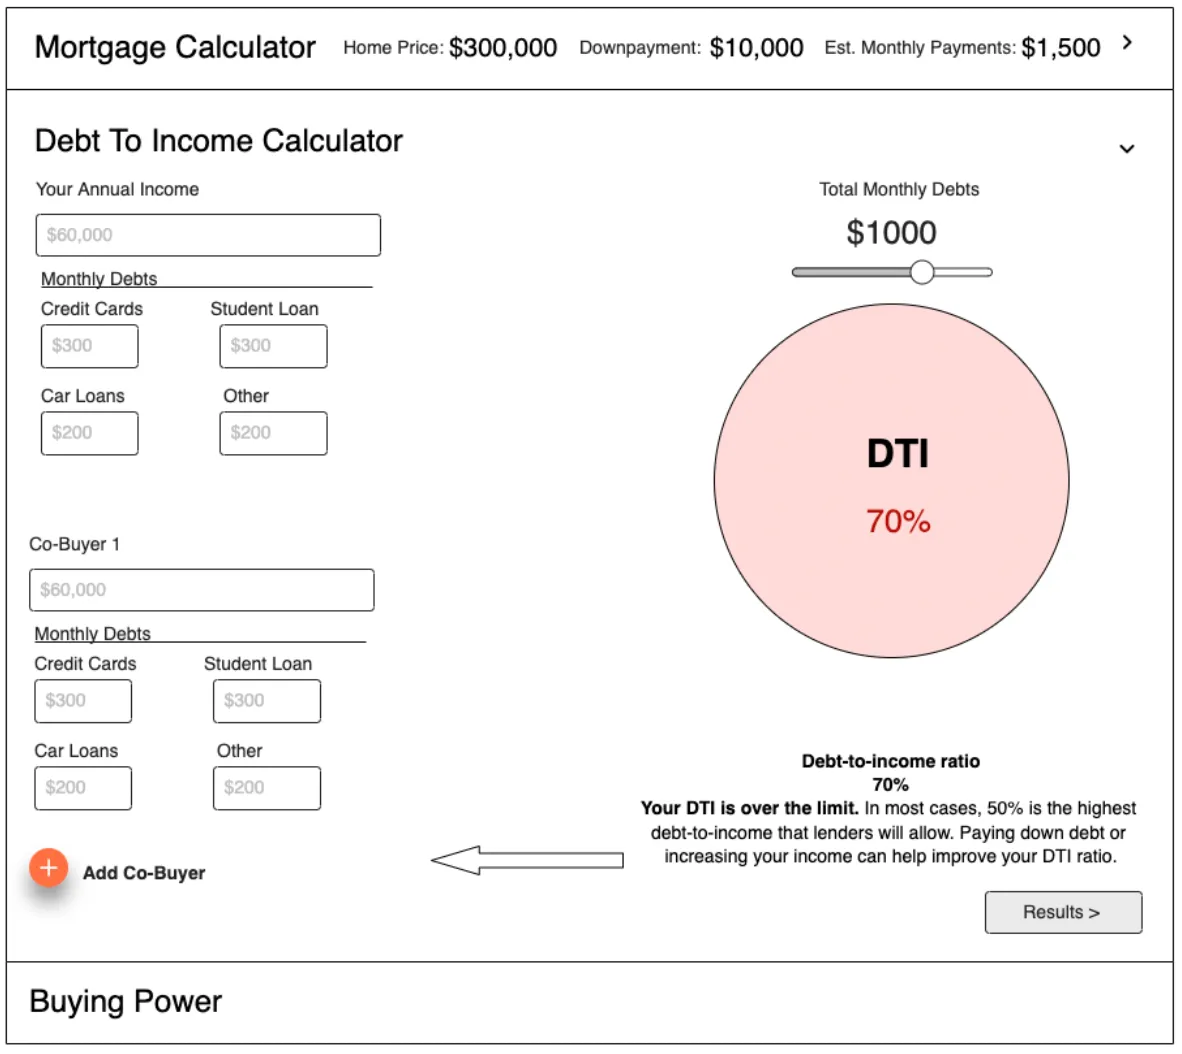
The complexity arose when incorporating co-buyers. Adding another co-buyer not only amplifies the down payment deposits in the mortgage calculator but also necessitates the division of monthly debts for the DTI calculation. Subsequently, the calculator must calculate the sum of the split payments.

For instance, when there are two co-buyers, the total is divided by two for split payments. Similarly, for three co-buyers, it is divided by three, and so forth, up to a maximum of four co-buyers for the product scope.

Using Excel calculations, distinct sections were allocated for one, two, three, and four buyers, with development documentation.

Co-Buyer Payment
Your housing payment divided by the number of co-investors. This will only show if there is more than one buyer.

Add Co-Buyer
Split payments.

BUYING POWER

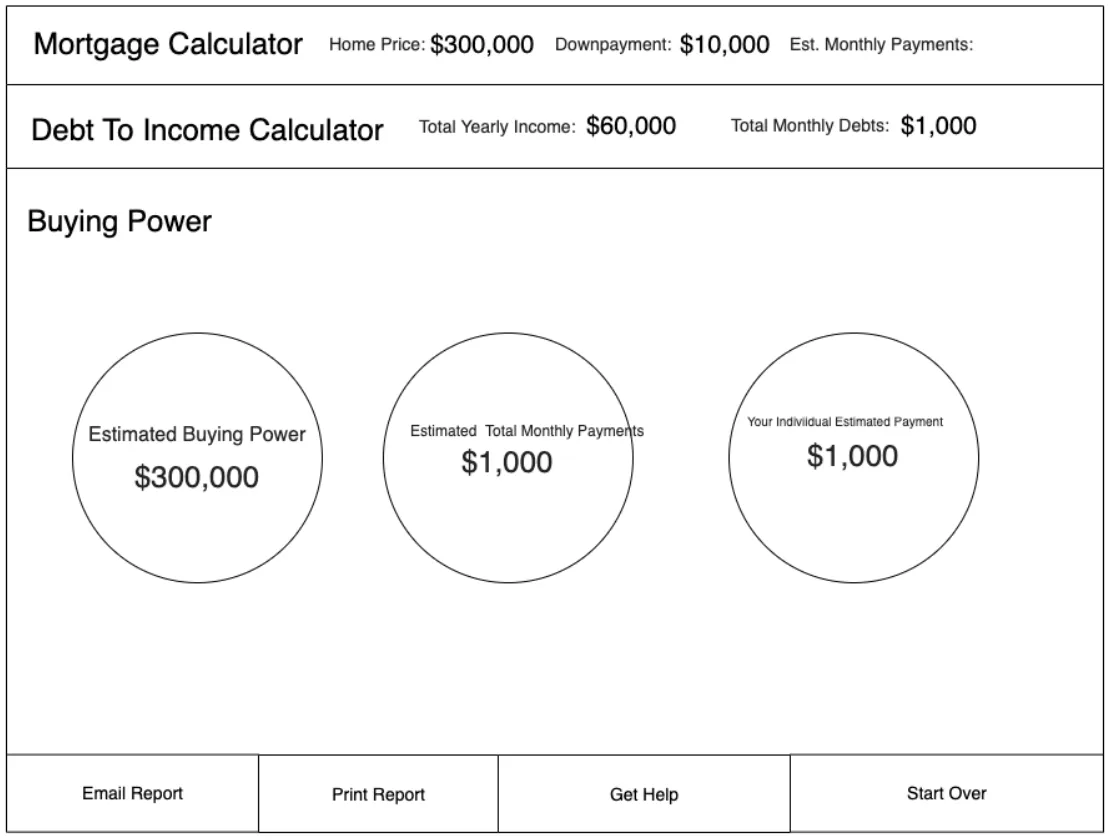
We mocked a straightforward design to display estimated purchasing power for individuals and groups, along with total and split payments.

Initially, we planned to restrict access to the calculator within the platform, requiring users to sign up. However, recognizing its potential as a lead generation tool, we enhanced its functionality to make it publicly accessible. Users would be able to interact with the tool live, with options to email or print the report for their records, or schedule a consultation with Pairgap. Additionally, users can experiment with affordability estimations based on their zip code location.

The user is now presented with accurate financial information that can significantly enhance the purchasing capacity for individuals and partners looking to buy property together.

TAX CALCULATIONS

We consulted with loan officers and real estate professionals throughout this process, who provided valuable feedback on the calculations. The consensus was to manually input tax rates due to inconsistencies in average public data. As a result, we pivoted our tax calculation strategy to prioritize accuracy for buyers. While our initial automation plan was ambitious, the potential for inaccuracies prompted us to remove Zip Code automation from our design and development process.

FINAL PRODUCT

This innovative Co-Buying Calculator has proven invaluable in demonstrating the purchasing power for co-buyers and generating leads for potential real estate investors.

The duration of onboarding consultation calls between buyers and real estate professionals decreased by 75%, reducing the average call time from 150 minutes to just 36 minutes.

Additionally, home closings saw a notable increase of 40% within a 90-day period. Buyers now navigate through the co-buying process more efficiently, gaining a clear understanding of their affordability with automatic adjustments, regardless of changes in the number of co-buyers.

Furthermore, we achieved a 205% increase in leads from prospective buyers and groups, calculated based on the rise in onboarding calls from intake forms and email list signups. The project went live after three months of completion, including testing.

Test the product yourself: https://pairgap.com/calculator/

MY ROLE

Gathering Requirements, Competitive Analysis, Product Vision & Strategy, Feature Definition, Mockups, Wireframing. Worked collaboratively and managed a tech team of seven: 2 UX designers, 1 researchers, 1 data analytics, and 2 developers.